Analytics
Upgraded projects in Nordcraft are billed according to how many requests a project receives. You can monitor requests to your Nordcraft projects at an organization or project level.
Request types
Requests to your Nordcraft projects can be one of three types:
| Request type | Description |
|---|---|
| Page requests | A page request, redirect, or proxy. |
| Proxied API requests | An API request that is routed through Nordcraft's edge network from the client. Find this setting in the advanced options in the API panel under fetching options > proxy request. Proxied API requests made during SSR are free. |
| Custom element requests | A request for a custom element (web component) exported from a Nordcraft project. |
Organization analytics
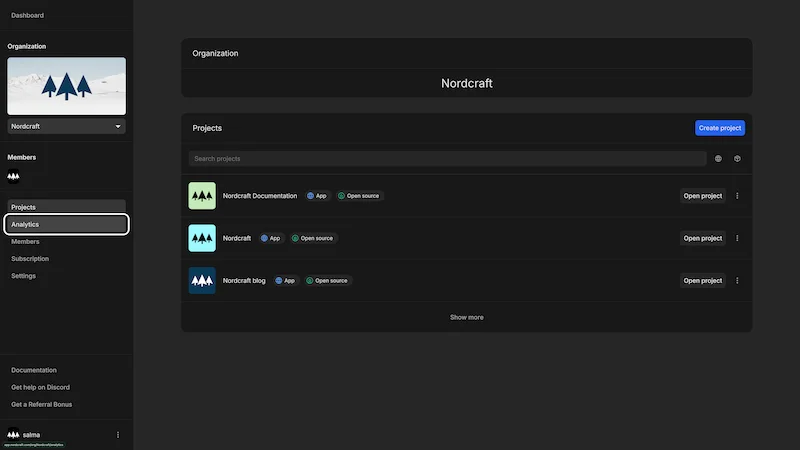
To view your organization requests, navigate to an organization, and select Analytics in the left sidebar.
You will see a graph showing requests to all of your projects over time. Below, you'll see a table containing the request data including the project, branch, HTTP request method, and number of requests.
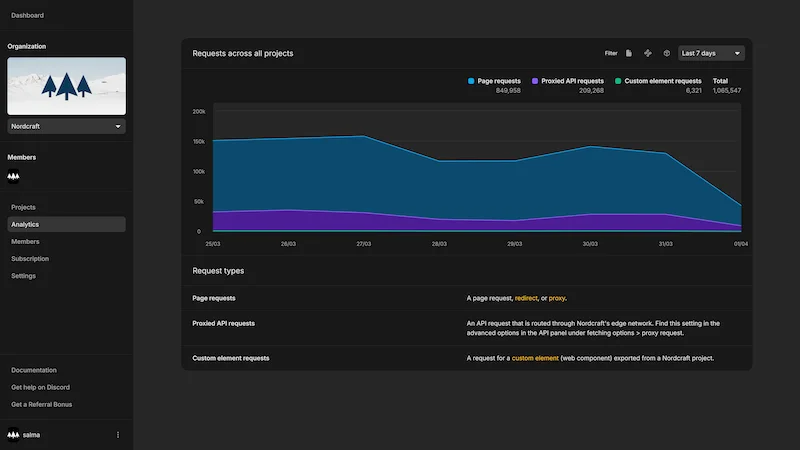
You can use the filters at the top right of the graph to narrow down the request types you wish to view, or change the time period on the graph.
Hover over the table rows to see all information in one card, including the full request URL (without any query parameters).
Project analytics
To view requests for a single project, navigate to a project details page. Scroll down to find project requests underneath the list of currently active branches and version history.
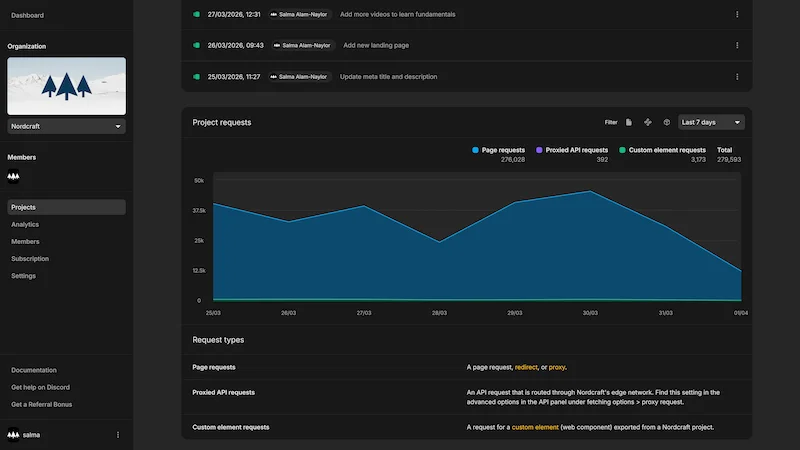
You can use the filters at the top right of the graph to narrow down the request types you wish to view, or change the time period on the graph.